April 2026
Uptime report
The Netherlands turned orange for King’s Day, but our metrics stayed green. 100% uptime for April 👑
Check the always-on status here.
March 2026
Uptime report
March brought the first buds of spring, and our uptime was in full bloom. 100% availability 🌷
Check the always-on status here.
February 2026
Uptime report
In February: 28 days, 0 interruptions, 100% uptime.
Check the always-on status here.
January 2026
Uptime report
The AMP experienced 3 brief unplanned API interruptions due to database connection starvation and a performance regression.
We applied a hotfix to mitigate downtime, identified the root cause, and restored system stability by reverting a recent gateway change.
Check the always-on status here.
December 2025
Uptime report
The best Christmas gift we could offer was silence from your alert systems. We maintained 100% uptime in December 🎁
Check the always-on status here.
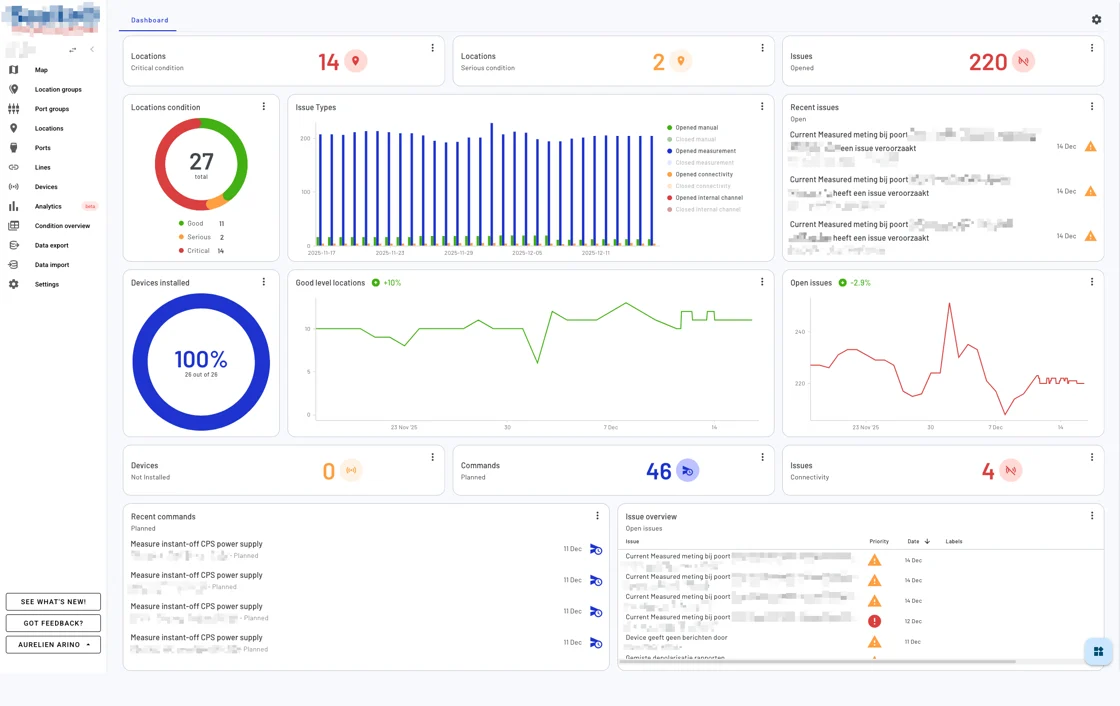
New dashboard
We launched a completely redesigned Dashboard!
This dashboard lets you create a personalized overview using flexible, drag-and-drop widgets. Rearrange, resize, and configure them to match your workflow and highlight what matters most.
🔍 What can you monitor?
Here are just a few ways to use the new Dashboard:
- Devices – Track installation status, trends, and counts
- Issues – Monitor open/closed issues by type, severity, or labels
- Locations – Visualize health status by level and spot long-term trends
- Commands – Stay updated on command execution states and timelines
📊 Widget types you can use
Each widget gives you a different lens into your data. Use them to track real-time statuses, spot trends, or dive into detail:
- Counters – Key figures at a glance (e.g., total issues, installed devices)
- Charts – Visualize trends and distributions using donut, bar, or line charts
- Lists – See the latest issues or commands as they happen
- Tables – Get a detailed view with advanced filtering
- Trend indicators – Analyze changes over time to spot early warnings
✨ Easy to customize
Click “Arrange dashboard” to enter edit mode and:
- Add widgets from the widget drawer
- Drag to reposition and resize
- Filter data by type, severity, or state
- Remove anything you don’t need
It’s all saved automatically, with changes shared across users in the same environment.
The new Dashboard is now live in your environment. Just log in, click the “Dashboard” tab, and start customizing.
Need help getting started? Check the documentation on our renewed user documentation page or reach out to our support team, we’re happy to assist.
November 2025
Uptime report
Leaves are falling, but your connection isn’t 🍂 We achieved 100% uptime in November!
Check the always-on status here.
October 2025
Uptime report
Despite Halloween, we have no skeletons in our closet. The AMP maintained a frightfully 100% uptime last month. That’s zero ghosting from your assets 👻
Check the always-on status here.
Compare asset locations more easily
The new Click&Compare feature allows you to easily compare multiple locations on selected quantities (e.g. temperature). To use this feature:
1️⃣ Select locations
Hold Cmd (Mac) or Ctrl (Windows/Linux) and click on the locations you want to compare directly on the map. The map view will remain unchanged as you select multiple locations.
2️⃣ Start comparison
After selecting the locations, click the “Compare X locations” pop-up that appears at the bottom of the screen.
3️⃣ Configure comparison
Choose the quantities you want to compare, and select the desired time window for the comparison.
4️⃣ Customize view
In the top-right corner menu of the comparison view, you can:
- Adjust the graph size window (small, medium, or full-width).
- Change the line colors for better visual distinction between locations.

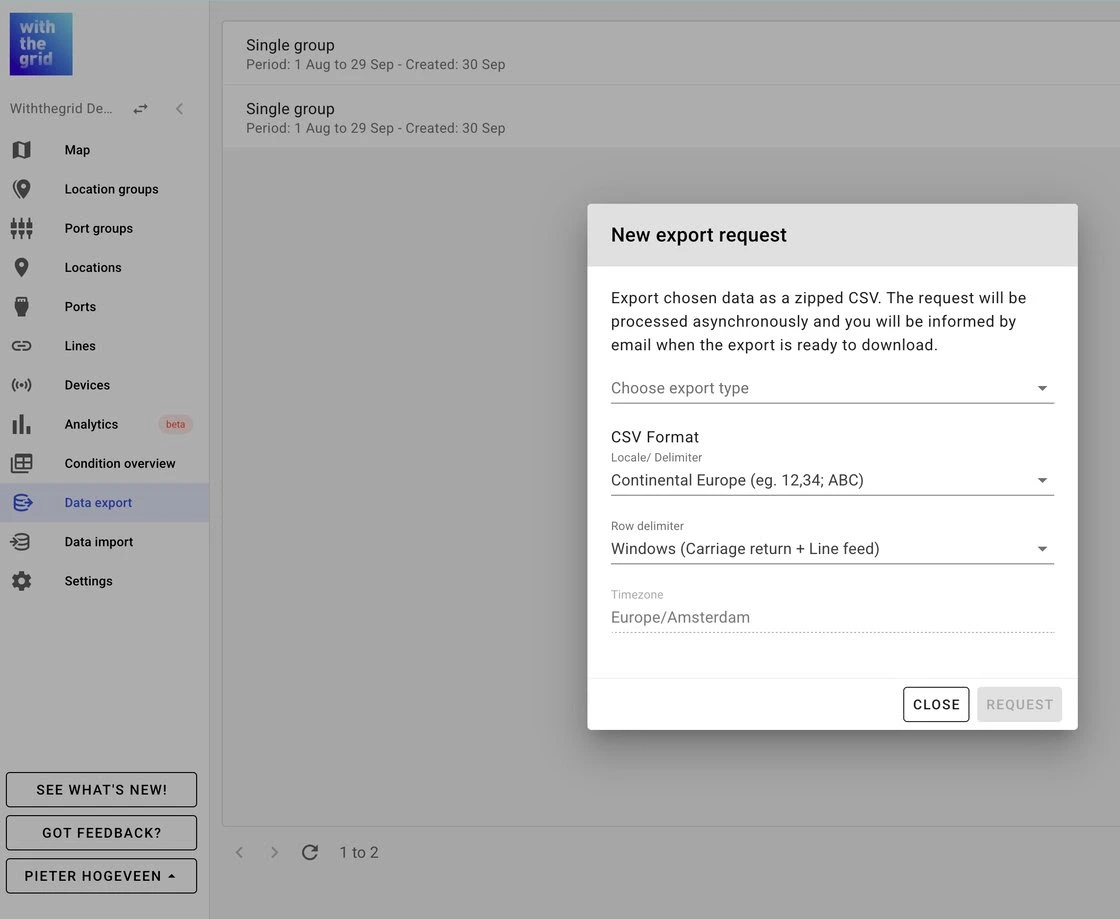
Improved export feature
We’ve upgraded the export system to make it faster and more reliable:
- No more limits: Export much larger datasets now that the row limit has been removed.
- Improved performance: Large exports are handled more smoothly, without timeouts.
- Live status: Track your export progress in real-time with a status bar.
- Future-ready: The new architecture supports upcoming features like cancelling or resuming exports.
Feature in the spotlight: Labels!
Keep your workspace organized and your team aligned by using labels on issues. Labels help you categorize, filter, and prioritize issues based on themes, asset types, causes, or workflows.

September 2025
Uptime report
With the back to school rush, the last thing anyone needs is a distraction. We did our homework: the AMP ran at a flawless 100% uptime last month 💼
Check the always-on status here.
August 2025
Uptime report
While many were enjoying a summer holiday, our systems kept working. The AMP achieved a 99.99% uptime in August 🏖️
Check the always-on status here.