NEW analytics map widget
Hey ,
We’re excited to share with you the new features we have added this month to the Withthegrid platform.
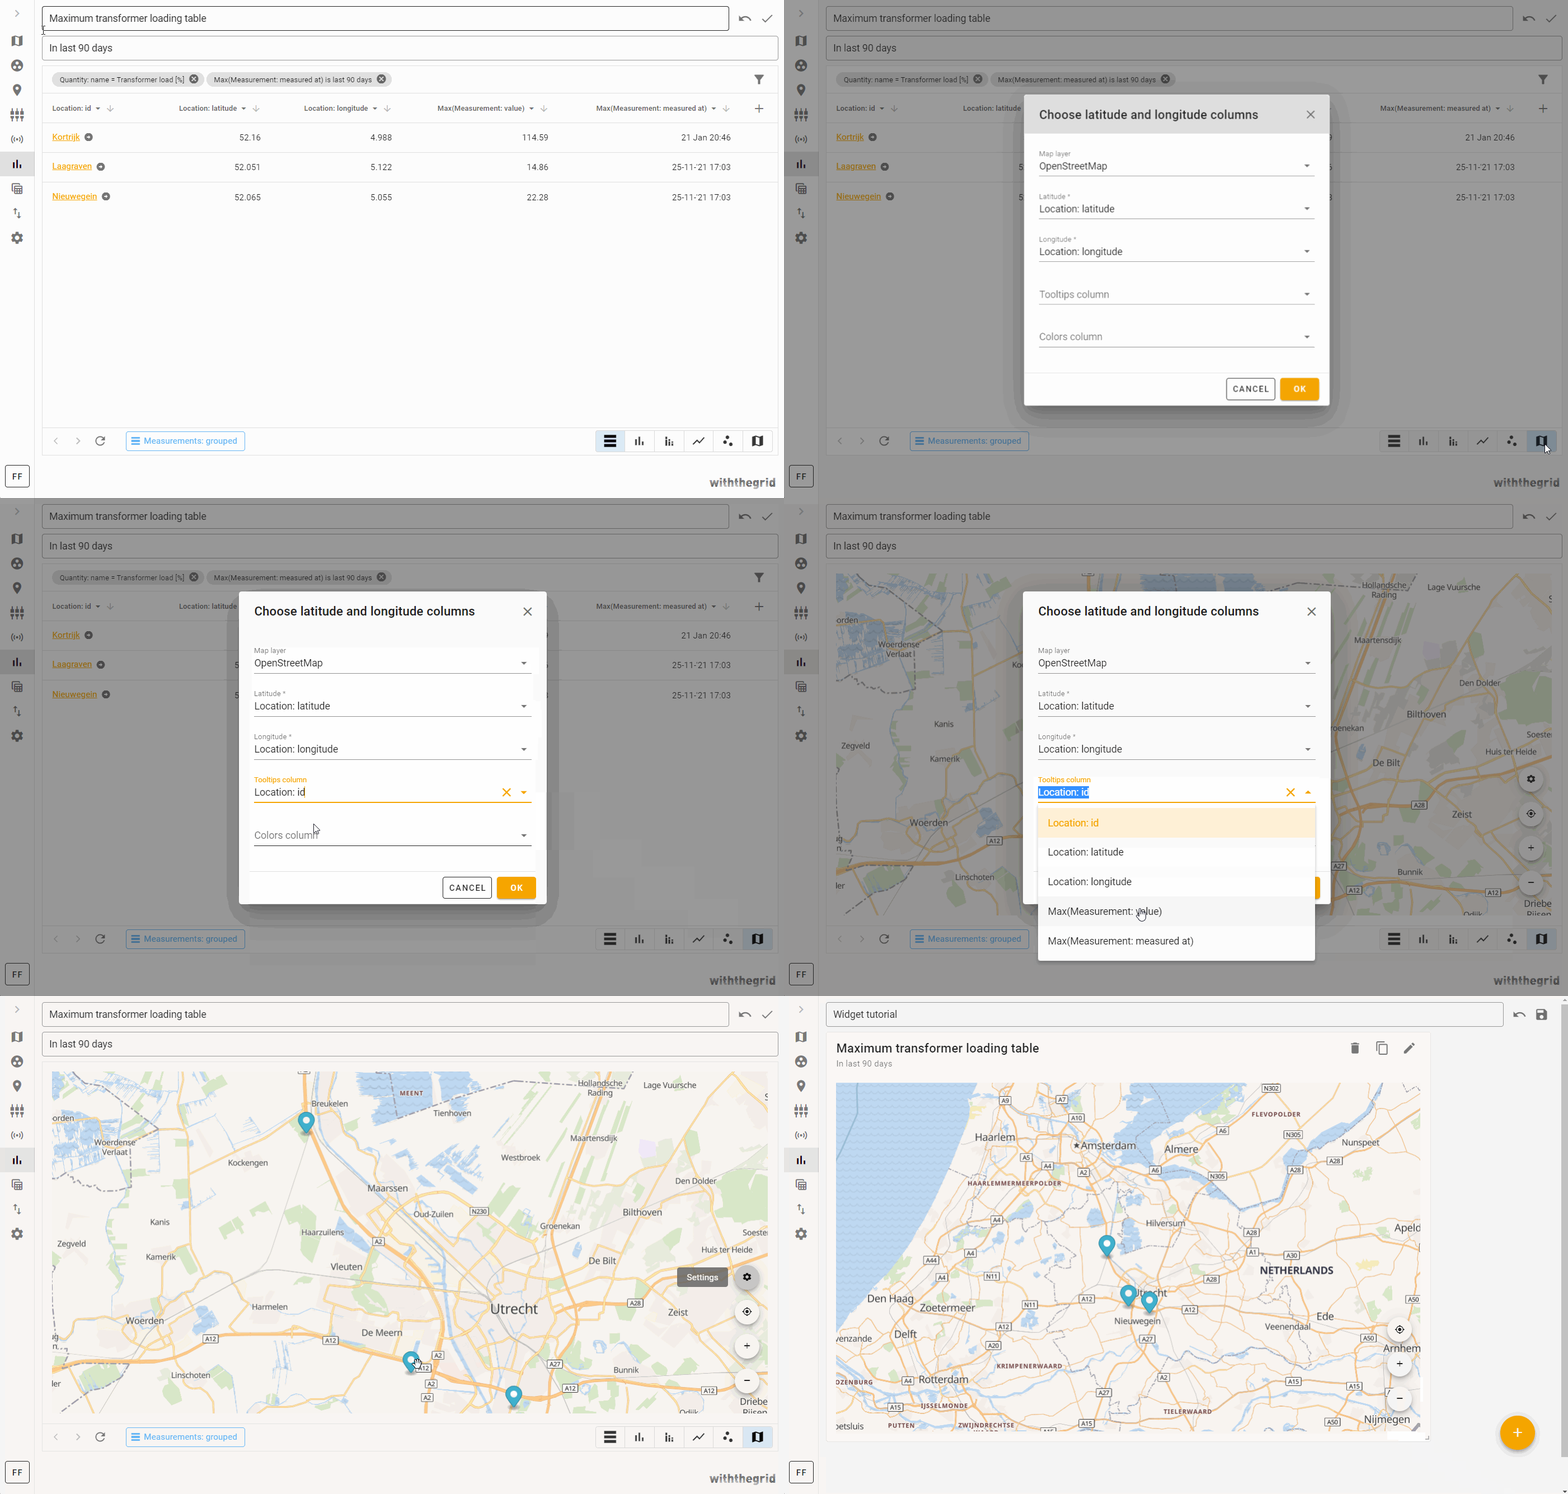
We have added a new widget to the analytics feature
This gives users the power of analytics to create custom maps. Such a map widget can improve the overview of assets of interest. In the following GIF, we demonstrate how you can filter for a single type of asset and create a map widget with a custom tooltip.

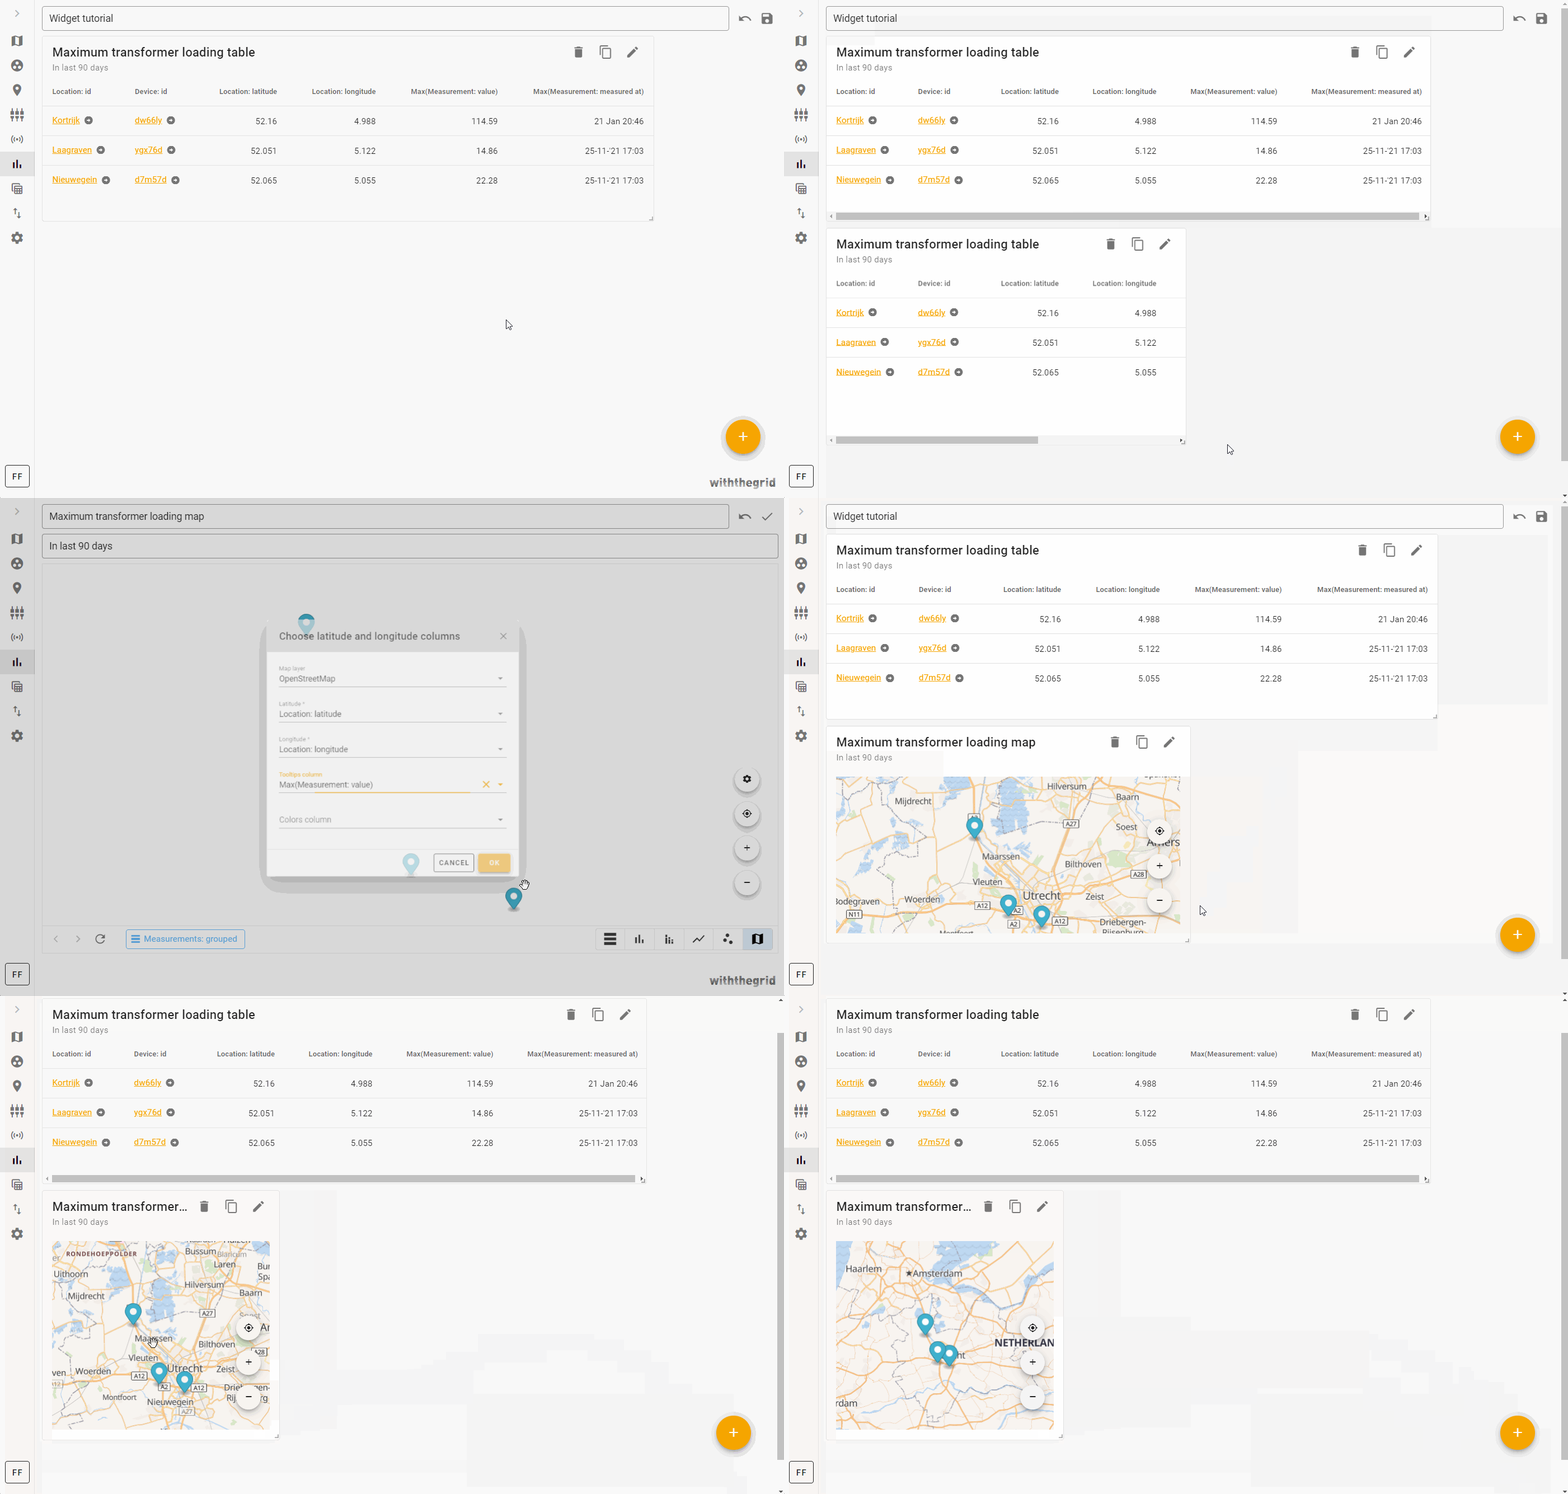
Duplicate widgets
Duplicating widgets is now possible with a single click of a button. This comes in handy when you want to use an existing widget as a starting point for a new one.

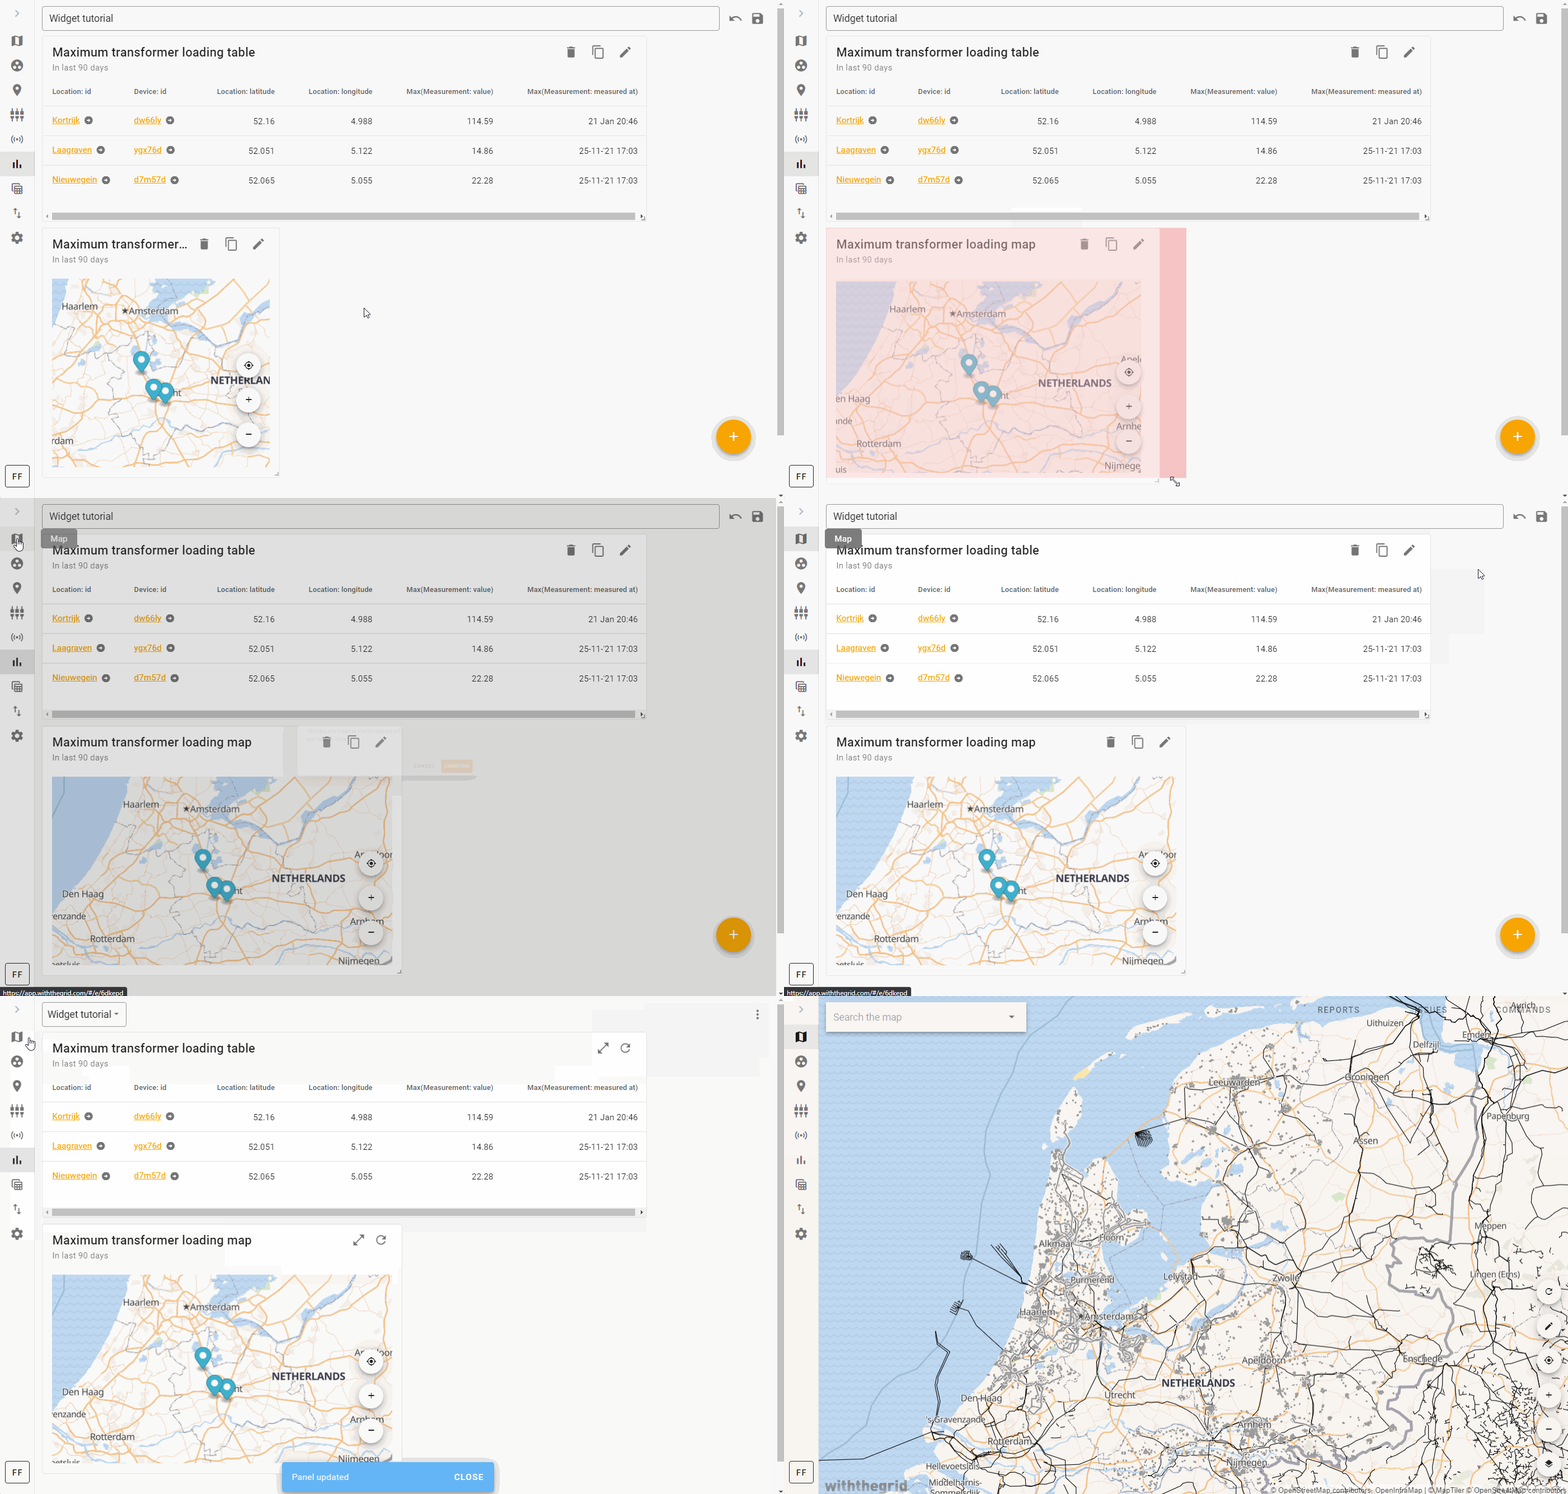
Warning about unsaved changes
We will now warn you if you have not saved your work. Leaving a page and losing your work unnoticed is now not an option!

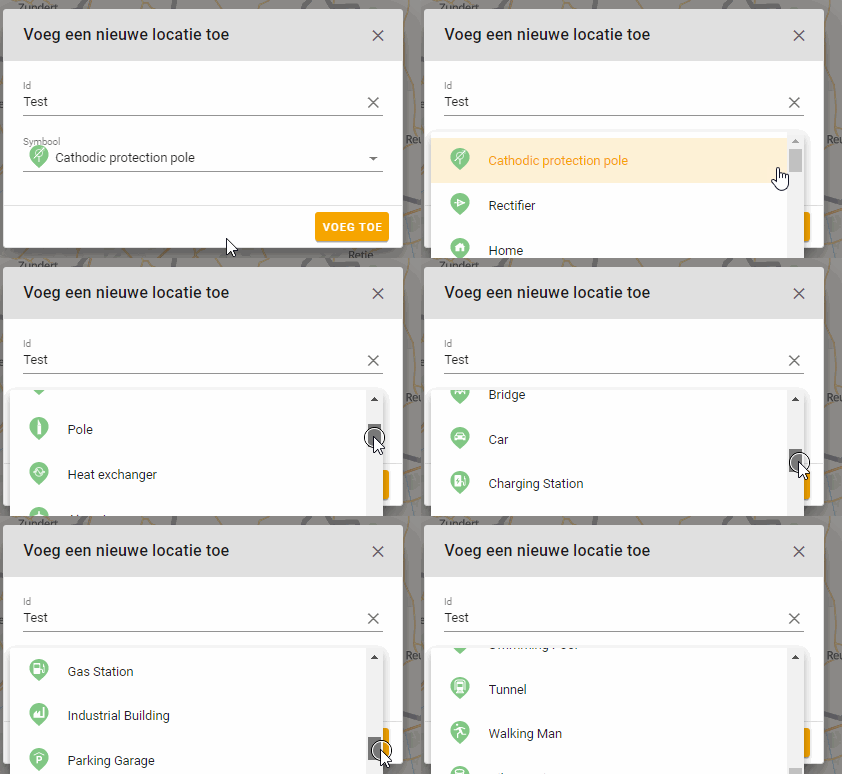
New location icons
We have added a number of new icons to customize and better visualize your location on the map. Go to ‘Properties on a location to change this.

A short video on the analytics line chart
Are you interested to see a short video on how to create an analytics line chart? Watch this video!
Learn more about the Withthegrid platform
You can always find more information about the platform functionalities in the Withthegrid docs. In the meantime, we’d love to hear any feedback you have and what we can do to make the platform even better. Don’t forget to check our new how-to videos on our YouTube channel!
Cheers,
Withthegrid team

Get in touch!
Did this blog raise any questions? Is there something the Withthegrid team can help you with? Either click ‘learn more’ to get to know more about the team, or hit the contact us button down below!